Pivotal Benchmark Index
Creating a dynamic data visualization and analysis platform that explores how great development teams work.

As a leader in modern software development platforms, tools, and methodologies, Pivotal is uniquely positioned to analyze how effective development teams work. After conducting an in-depth research initiative that involved surveying over 1,600 technology leaders across five countries and six industries, Pivotal approached Type/Code to design and build a platform that visualizes the insights revealed through this research, and create an evaluation tool that allows anyone to analyze their own team’s technology approach in relation to their industry.
Revealing key insights
To bring these data-driven insights to life, Type/Code collaborated with Pivotal’s research partners to help analyze a massive pool of raw data, and explore how key findings could be visualized. Early in the strategy process, we identified the need to both facilitate editorialized visual summaries of key takeaways, will still allowing visitors to take a deep dive into the data, and explore responses to specific questions by region or industry. We designed a suite of visualization components that Pivotal’s team could assemble as needed into key find summaries, alongside a powerful data exploration tool that allows visitors to explore the full set of responses.
Powerful data exploration
To support this visualization platform, we developed a Python/Django based application layer that balanced standard CMS functionality for informational content with a fully custom data management solution. With a distributed data collection and analysis process happening on a compressed timeline, we streamlined Pivotal’s internal workflow by creating a system to dynamically parse spreadsheets holding application data, mitigating a tedious data entry process, and enabling Pivotal’s team to easily update the platform with new data sets as they become available.
The visualization interface was developed using D3, allowing a flexible array of charts and visualizations to be dynamically rendered performantly across a wide range of web contexts, and support an evolving data set.


Creating a participatory experience
A key component of the Pivotal Benchmark experience was a 5-minute questionnaire tool — a quantitative framework that allows visitors to assess their organization’s software development practices relative to other industries and countries, to examine how they compare. Upon completing the questionnaire, participants receive a customized data-driven report, comparing their performance against industry standards, and further breaking down areas of improvement into 3 actionable categories. The questionnaire report was designed to generate dynamically, resulting in an output summary and analysis that is completely tailored to each participant's responses.
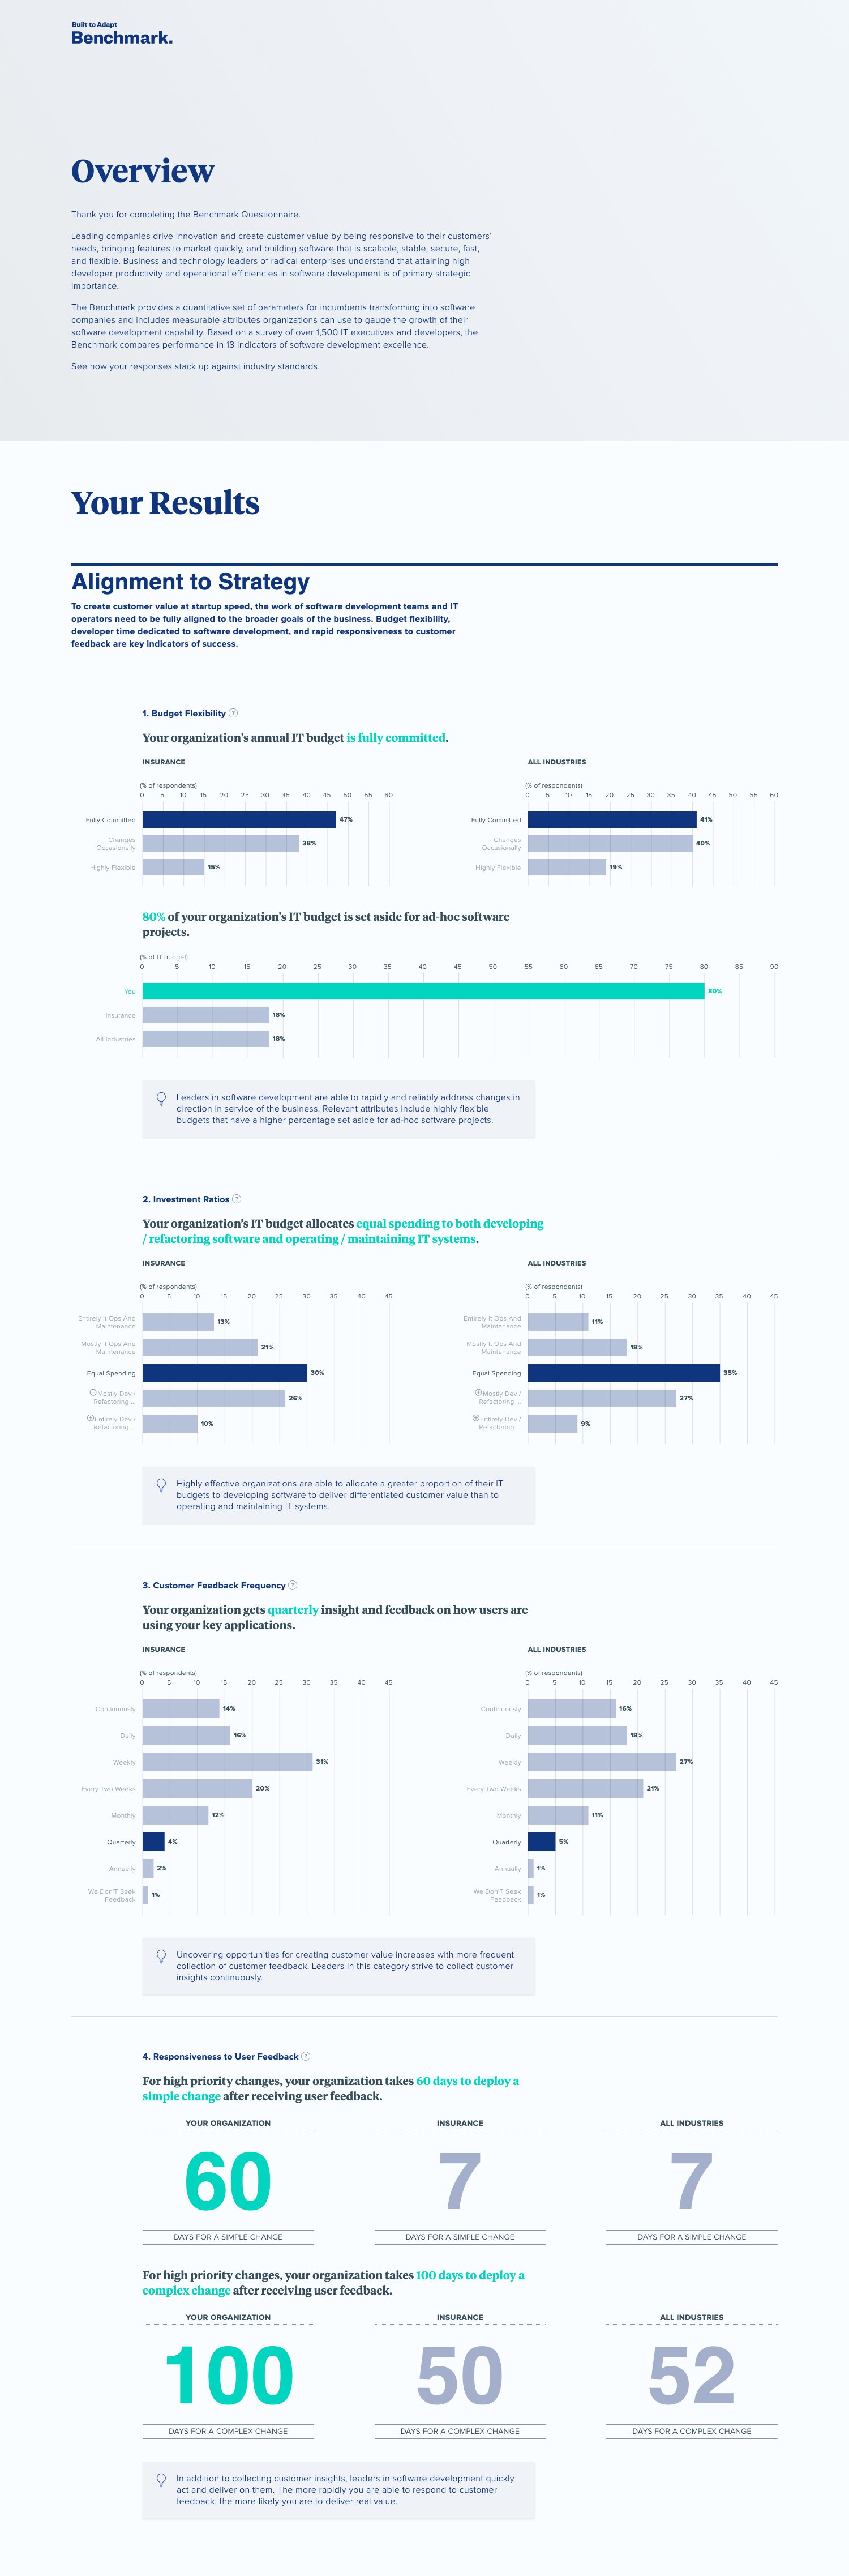
Dynamically Generated Report
A customized report is generated using the participant's questionnaire responses.Comparative Analysis
A set of data visualizations compare each participant's responses to both industry-specific and global standards.Actionable Insights
Providing actionable insights to participants based on Pivotal's analysis of industry best-practices.Launching a platform for industry analysis
Pivotal launched the Benchmark Index across its network of industry events, leading the community dialog around how technology teams can perform most effectively, and empowering the community with a resource for self-analysis, leading to deep participant engagement, and wide industry press.
What started as millions of disparate data points collected from development teams around the world, the Pivotal Benchmark Index successfully revealed the insights from this research initiative with concise interactive data visualizations, and a robust platform for continued data aggregation and participatory analysis.
Sharp Type →
Scholastic BookFlix